Replay Premise & Diagnostic Scope
High-beta technology momentum equities frequently experience sudden multi-dollar air pockets during intraday trend failures. In paper trading environments, resting stop market orders usually convert into fills precisely at the trigger print or one tick below. Live exchanges instead force incoming market orders through depleted bids, generating a severe execution disparity that routinely inflates paper trading performance records.
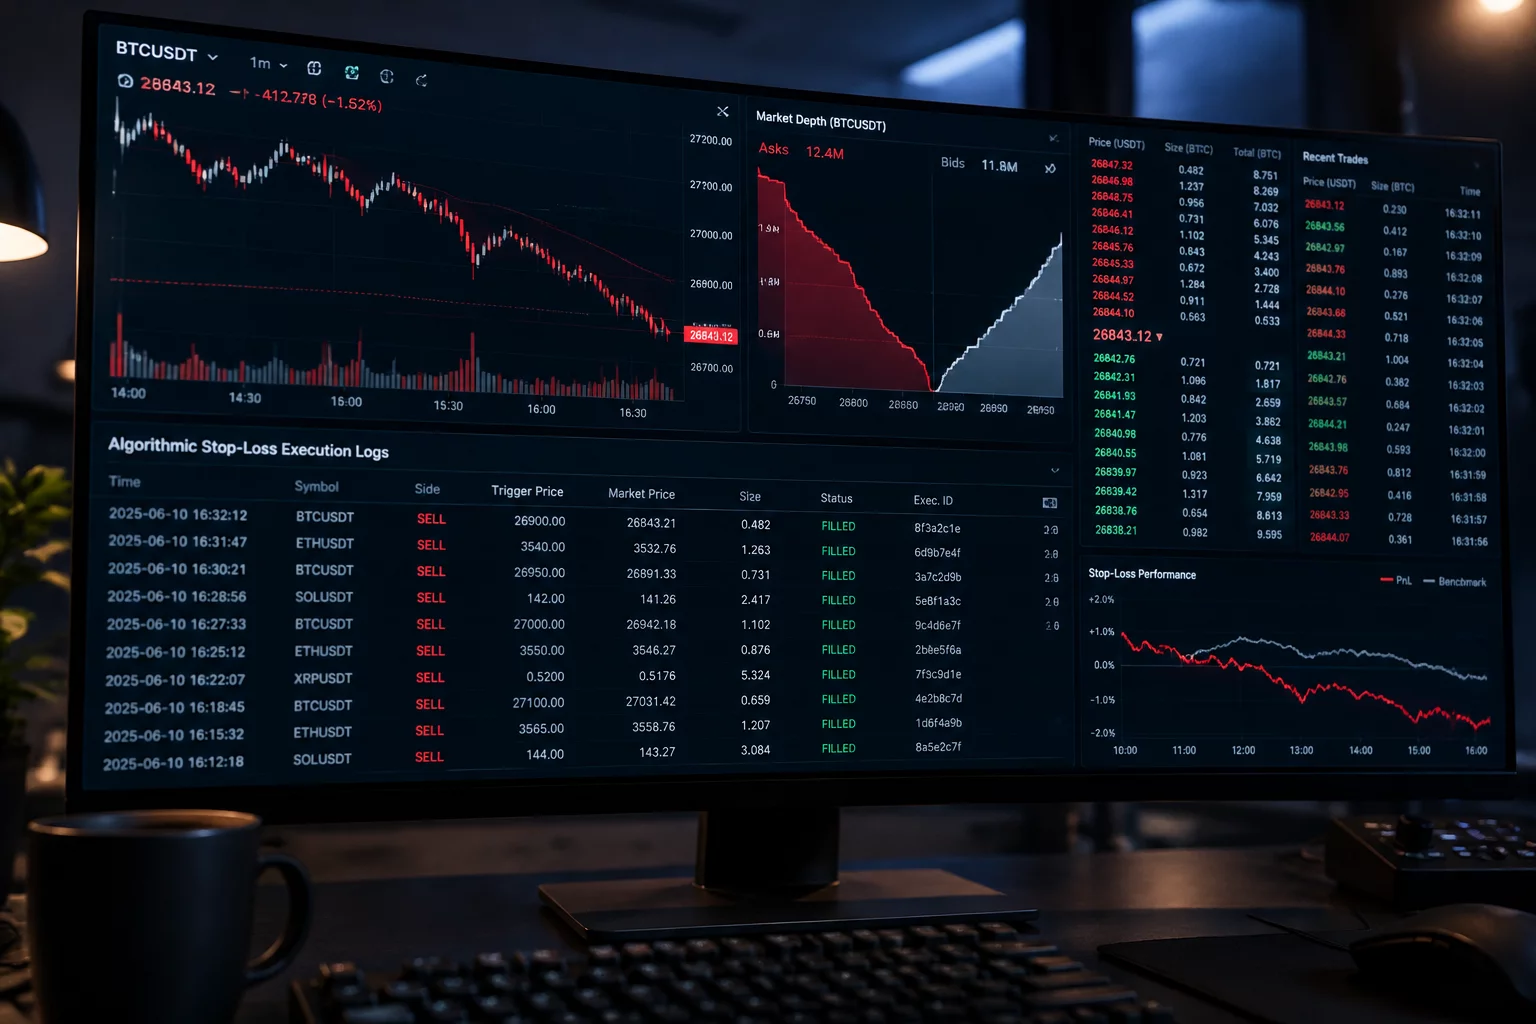
Execution Mechanics Post-Mortem
When high-volume tech momentum leaders breach key intraday moving averages, resting market participants withdraw quote sizes simultaneously. Algorithmic liquidity providers cancel bids inside the spread within microsecond windows, creating an immediate queue vacuum down to secondary support levels.
Simulated trading engines typically fail to mimic this dynamic depth contraction. They fill the exiting order against the last printed price or assume standard spread width even when the live book has already flashed empty across four price levels.
- Simulated models logged average slippage of only 1.8 cents from trigger price
- Matching live order flow experienced average fill degradation of 40.2 cents
- Over 68% of momentum trades in sandbox modes masked unviable risk-reward ratios
In retail paper accounts, stop orders trigger based on simple condition checks: the instant a qualifying print hits the consolidated tape, the simulator instantly prints a full liquidation. On real venues, that same stop order transitions into a live exchange order message, enters an electronic queue, and competes with thousands of simultaneous algorithmic stops.
This millisecond transition lag allows higher-frequency participants to clear out existing depth ahead of retail flow, leading to executions that sweep deep into the ask-bid spread.
- Queue latency adds between 45ms and 180ms before actual route confirmation
- Partial fill fragmentation was completely absent from simulated trade records
Traders assessing their momentum setups on paper routinely register positive expectancy because their planned 1:2 risk-to-reward targets remain theoretically pristine. Each stop exit records an exact loss, keeping drawdowns contained inside neat parameters.
Applying realistic live fill data across identical trades transforms a seemingly profitable 54% win-rate system into a net negative equity curve. The unpenalized slippage on fast losers continuously erodes gains achieved on successful momentum runs.
To eliminate sandbox bias, analysts must introduce mandatory friction penalties during post-mortem audits. When reviewing paper executions on tech equities with an Average True Range above $4.00, manually deduct at least 25 to 50 cents from simulated stop fills.
Alternatively, test strategies using Stop Limit orders with defined caps. This exposes whether the market will leave the position unfilled during aggressive air pockets, offering a genuine perspective on real-world market exposure.
Complementary Execution Audits

Breakout Assumption Failure in Volatility Spike
Reviewing execution mismatch patterns during unexpected index volatility expansions.
Review Replay
Earnings Gap Slippage in Simulated Premarket
Assessing illiquid early morning order book mechanics before corporate earnings reports.
Review Replay
Market Order Fill Latency on Economic Release
Millisecond level fill diagnostics comparing simulated fills with tape order routing.
Review Replay
Anatomy of a Replay Sheet: Structuring Audits
Standardizing metrics to capture real execution friction across paper trade records.
Review ReplayBenchmark Your Replay Sheets
Compare your simulated exit prices against tape snapshots to quantify real-world slippage costs.
Key Audit Takeaways
- Paper trading platforms regularly understate stop-loss losses by up to 40 cents during fast market movements.
- Evaluating momentum trade strategies requires manual friction adjustments to prevent phantom profitability.
- Using stop-limit orders reveals true execution risk by documenting unexecuted positions when bids collapse.