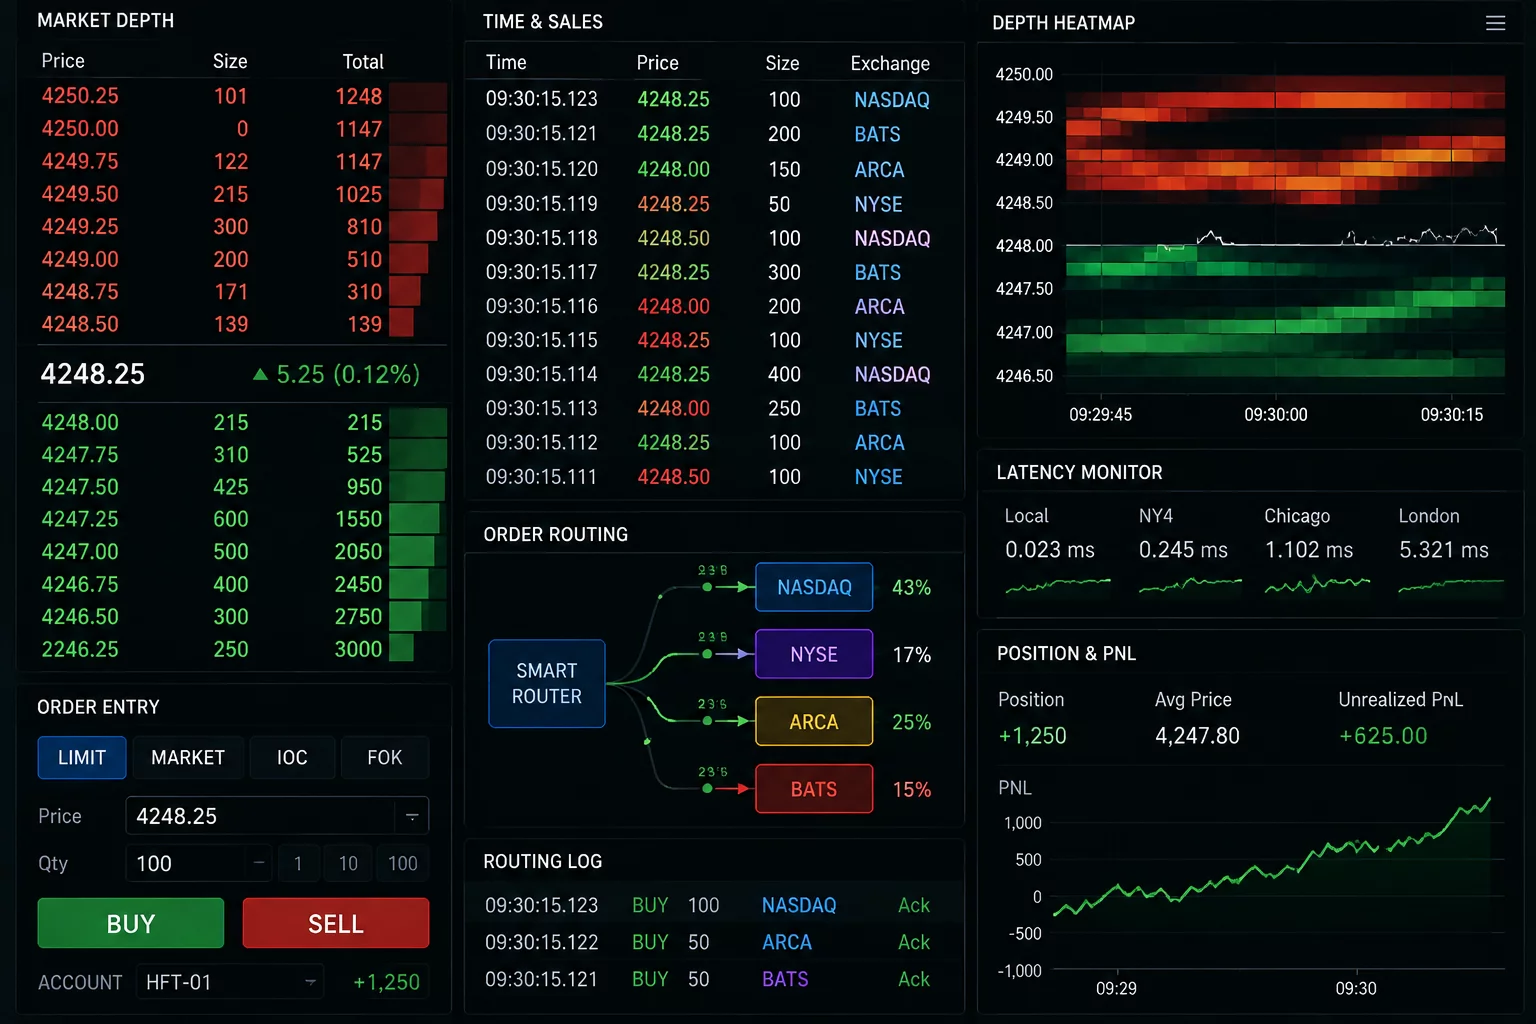
Replay Sheet structural layout capturing pre-entry thesis, simulated queue mechanics, and post-exit variance scoring.
Dissecting the mandatory data fields, psychological checkpoints, and microstructure metrics required to transform raw simulated fills into actionable operational intelligence.
Simulated trading logs frequently degenerate into vanity scorecards unless anchored by rigorous friction auditing and systematic counterfactual logging.
Standard brokerage execution journals record only timestamps, nominal fills, and resulting profit or loss. In a paper sandbox, these data points systematically mask structural execution deficits—such as infinite liquidity absorption at the inside bid, zero quote queue decay, and instantaneous bracket triggers. A true Replay Sheet functions as an operational audit ledger: it captures the quantitative setup hypothesis, logs simulated queue anomalies, tracks adverse excursion, and isolates execution variance from fundamental premise breakdowns.
| Audit Dimension | Protocol Standard | Benchmark Integrity |
|---|---|---|
| Pre-Entry Premise Hypothesis | Explicit quantitative trigger, market regime classification, and invalidation boundary recorded prior to order dispatch. | Mandatory Field |
| Friction & Slippage Delta | Divergence calculation between paper fill price and prevailing historical Level 2 consolidated tape depth. | Quantitative Metric |
| Queue Position Verification | Limit order fill verification assessing simulated queue priority versus required volume turnover at the price tick. | Microstructure Audit |
| Premise vs Variance Attribution | Binary post-mortem taxonomy categorizing trade result into procedural flaw, model invalidation, or stochastic dispersion. | Systematic Post-Mortem |
The primary flaw of typical trading journals is hindsight narrative rationalization. When reviewing trades retrospectively, an analyst inevitably imposes order on chaotic price paths, inventing explanations that flatter their market interpretation while overlooking execution flaws. A structured Replay Sheet prevents this cognitive leak by decoupling the trade lifecycle into chronologically isolated stages, enforcing strict observational rigor before, during, and after order routing.
To create an actionable post-trade audit, the logging sheet must document not merely what the market did, but what the sandbox engine assumed about market mechanics. Because modern simulator matching engines allow paper traders to capture limit fills on single-print touches without consuming depth-of-book volume, your review cadence must explicitly penalize frictionless execution illusions.
By systematically logging these fields across rolling 50-trade cohorts, the operator builds an empirical baseline of operational slippage. This allows trading desks to stress-test systematic strategies with realistic frictional haircuts rather than relying on paper money optimism.
An audit sheet that fails to measure simulated liquidity illusions is not a diagnostic tool; it is merely an emotional record of simulated fortune.
— Marcus Vance, Lead Execution Architect, PaperTrade Replay
Beyond price and timestamps, a Replay Sheet must track order queue volume at submission, historical Level 2 spread at entry, simulated fill latency, maximum favorable excursion (MFE), maximum adverse excursion (MAE), and an objective premise invalidation score.
It cross-references the simulated fill against the actual consolidated volume transacted at that tick. If total market volume at that price was less than three times your order size, the fill is flagged as a 'synthetic anomaly' and reassessed with conservative penalty slippage.
A sound directional hypothesis can show a loss due to unrealistically modeled spread expansion, while a terrible premise can produce a profit due to non-existent simulator fills. Isolating these forces ensures you do not abandon a viable model or scale an invalid strategy.
Explore our catalog of systematic trade post-mortems and friction breakdown studies.