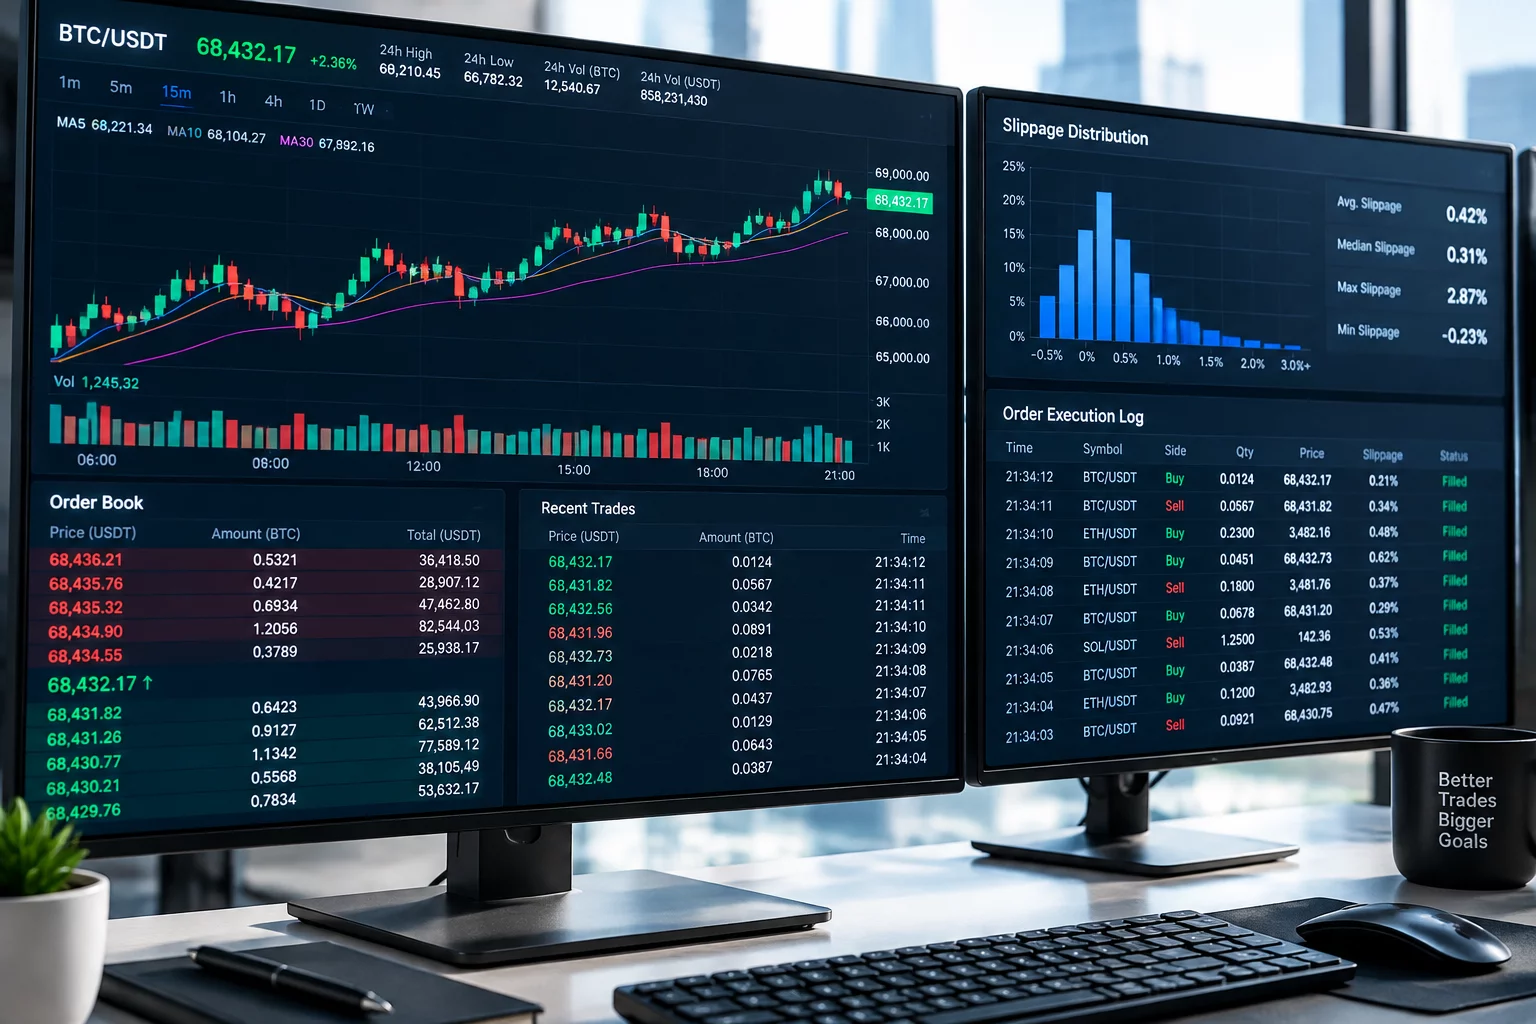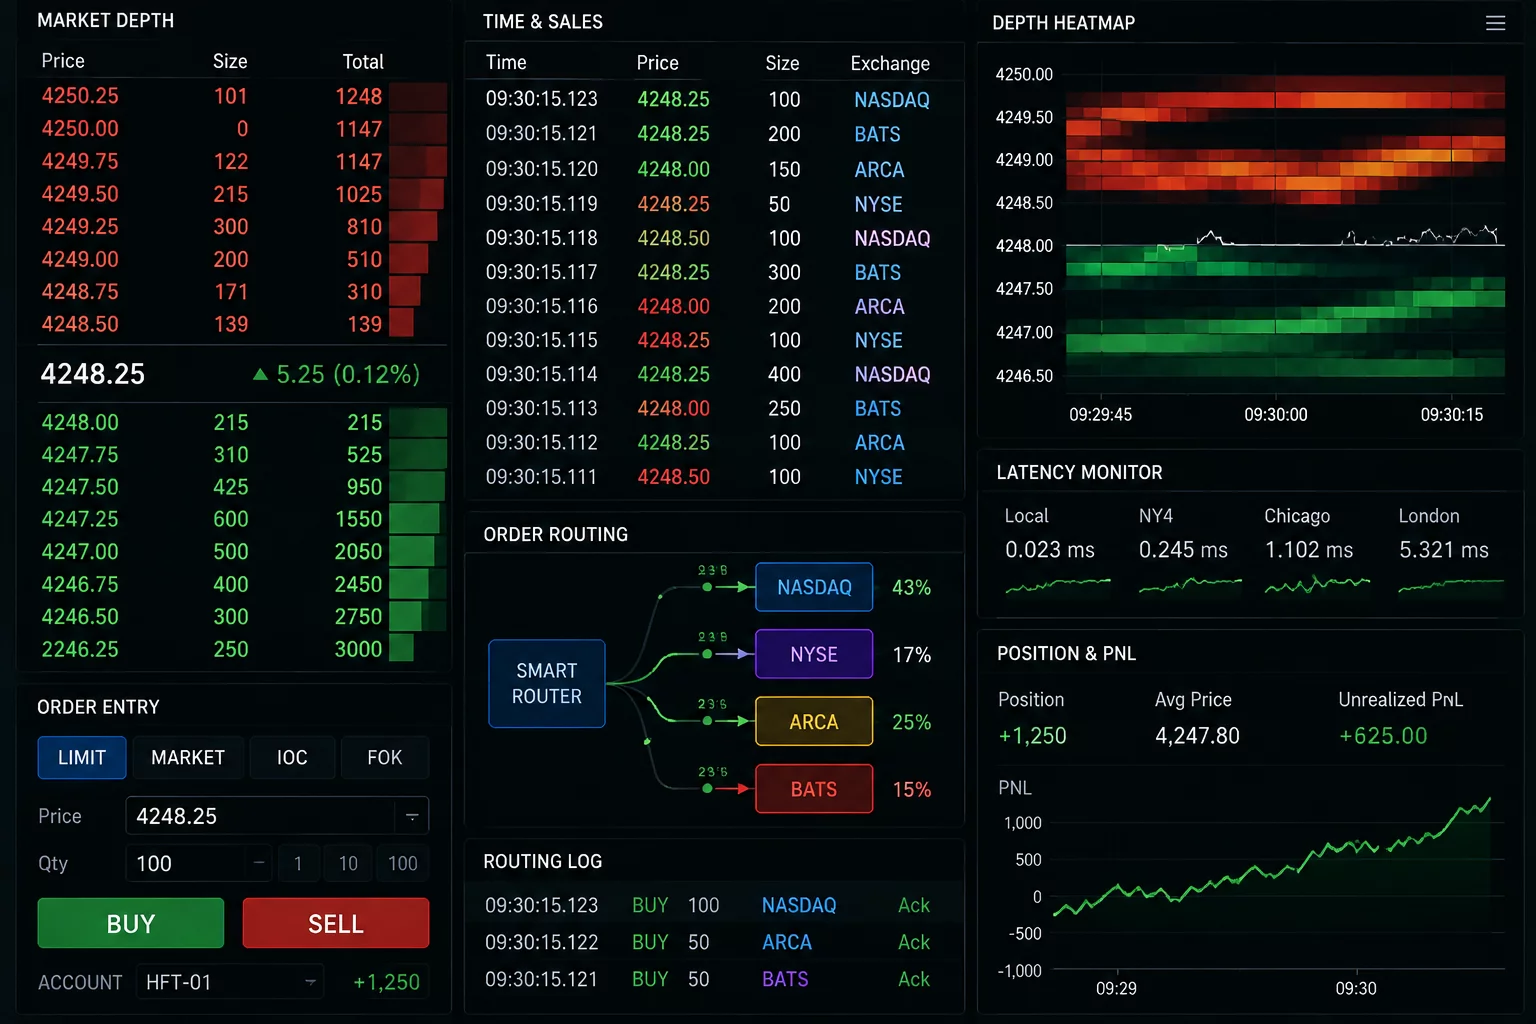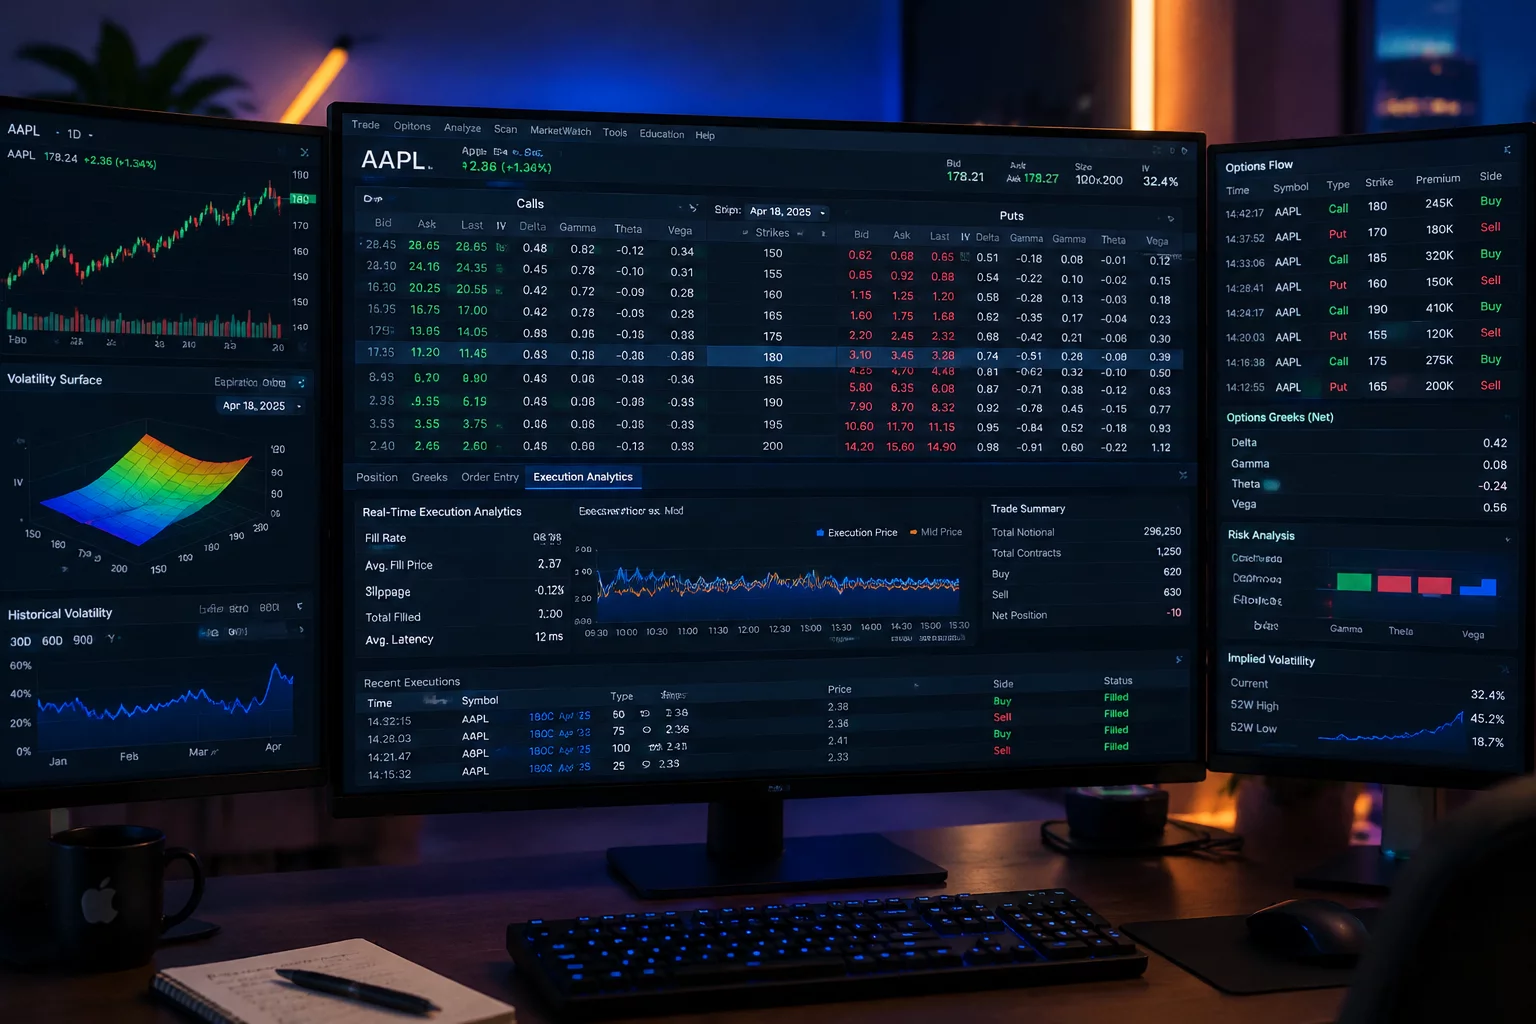
Options chain execution log contrasting simulated paper fills against NBBO depth and historical liquidity pools.
Why paper trading engines systematically overstate options profitability through theoretical mid-price fills and synthetic liquidity queues.
In live equity options markets, capturing the exact midpoint of a wide bid-ask spread is often an elusive luxury reserved for hyper-liquid indices.
Paper trading engines rely on simplified execution models designed to minimize computing overhead. When an order matches the midpoint or touches the bid/ask mark during simulated hours, sandbox matching engines frequently award an instantaneous complete fill. In live production environments, market makers calibrate quotes dynamically, stepping back or fading sizes as volatility shifts. This structural discrepancy creates an artificial performance dividend for paper accounts that evaporates upon deploying live capital.
| Execution Dimension | Sandbox Simulator Logic | Live Market Reality |
|---|---|---|
| Limit Order at Midpoint | Instant fill when mark touches limit | 42% Execution Gap |
| Multi-Leg Complex Order | Synthetic simultaneous fills on all legs | Legging Risk Masked |
| Wide-Spread Contracts (> $0.30) | Mark-price fill irrespective of order book depth | High Negative Alpha |
| Stop-Loss Trigger (Ask/Bid Slippage) | Triggered at exact stop tick without slippage | 15-30 bps Underestimated Drag |
The mechanics of options exchange routing differ fundamentally from single-stock equities. Options trade across sixteen domestic exchanges, each maintaining separate order books with complex market maker obligations and payment for order flow (PFOF) dynamics. In a simulated paper sandbox, this distributed routing mesh is collapsed into a single consolidated quote feed. The engine typically assumes that if a trade printed at $2.10, your limit order to buy at $2.10 was filled, ignoring time-priority queues and displayed contract sizes.
For strategies relying on multi-leg setups—such as iron condors, vertical spreads, and calendar spreads—the illusion is even more acute. A paper trading simulator calculates the net credit or debit by summing the instantaneous marks. In reality, complex order books (COBs) require either an electronic auction or natural liquidity crossing both legs simultaneously. Live market makers charge a spread penalty for crossing two legs, whereas paper trading engines execute multi-leg orders at theoretical combinations that would never trade live without severe price concessions.
By systematically discounting paper returns and modeling realistic frictional drag, traders prevent false confidence and calibrate risk models to withstand the harsh realities of live options order routing.
Treating paper options fills as genuine market validation is like practicing archery indoors without wind and expecting the same grouping in a gale force storm.
— Marcus Vance, Head of Quantitative Diagnostics
Simulators prioritize user responsiveness and computational speed. They check whether a limit price falls within the current National Best Bid and Offer (NBBO) or matches the last mark. Since they do not interact with live exchange order queues or market maker auction mechanisms, they execute orders optimistically at theoretical prices.
A standard 15-minute or 20-minute delayed feed divorces order execution from real-time underlying price action. A trader placing an order against delayed quotes is essentially trading against stale historical prices, creating severe execution skew compared to live synchronized data feeds.
Use a structured Replay Sheet that logs both the simulator fill price and the conservative natural NBBO quote at that exact timestamp. Track the difference as execution drag to establish your true net edge.
Explore our comprehensive repository of simulated trade post-mortems and identify hidden friction points before risking live capital.